- An EMA (exponential moving average) weights recent prices more heavily than a simple average.
- Price above a rising 20 and 50 EMA, with the 20 above the 50, points to an uptrend.
- In a trend, pullbacks toward the EMAs often offer better entries than chasing.
- EMAs lag and get whipsawed in ranges. Use them for direction, not as entry signals on their own.
What is an EMA?
A moving average smooths out price by averaging the last few candles. An exponential moving average (EMA) gives more weight to the most recent candles, so it reacts faster than a simple moving average.
The 20 EMA follows short-term price closely. The 50 EMA moves more slowly and shows the broader trend. Together they give you a quick read on direction and momentum.
Reading the trend with the 20 and 50
| What you see | What it suggests |
|---|---|
| Price above both, 20 above 50, both rising | Uptrend: look for buys |
| Price below both, 20 below 50, both falling | Downtrend: look for sells |
| EMAs flat and tangled, price crossing back and forth | Range: trend tools are unreliable |
Check more than one timeframe
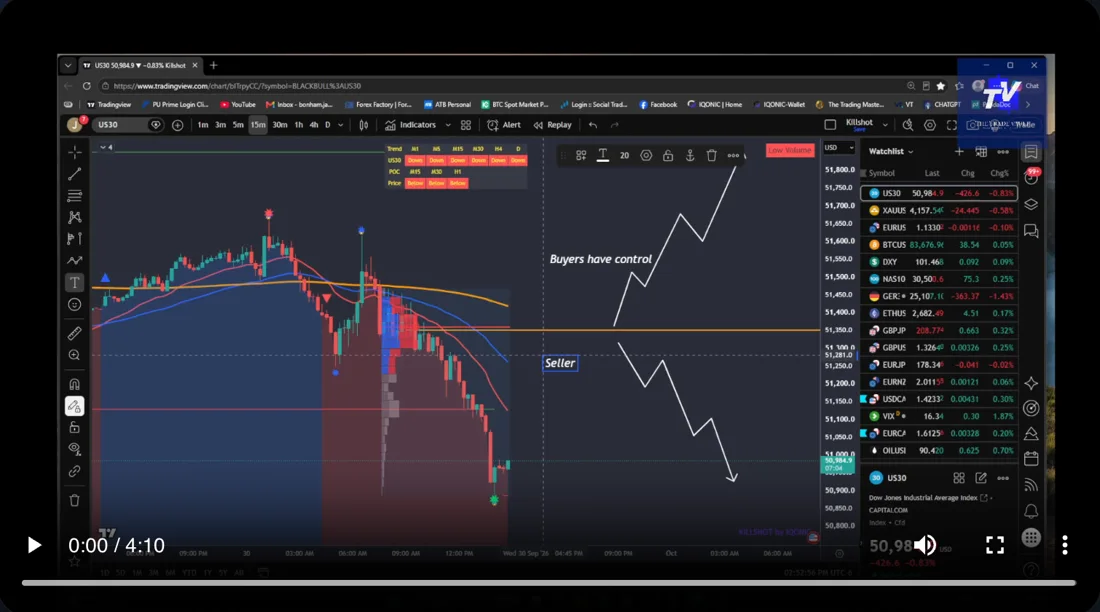
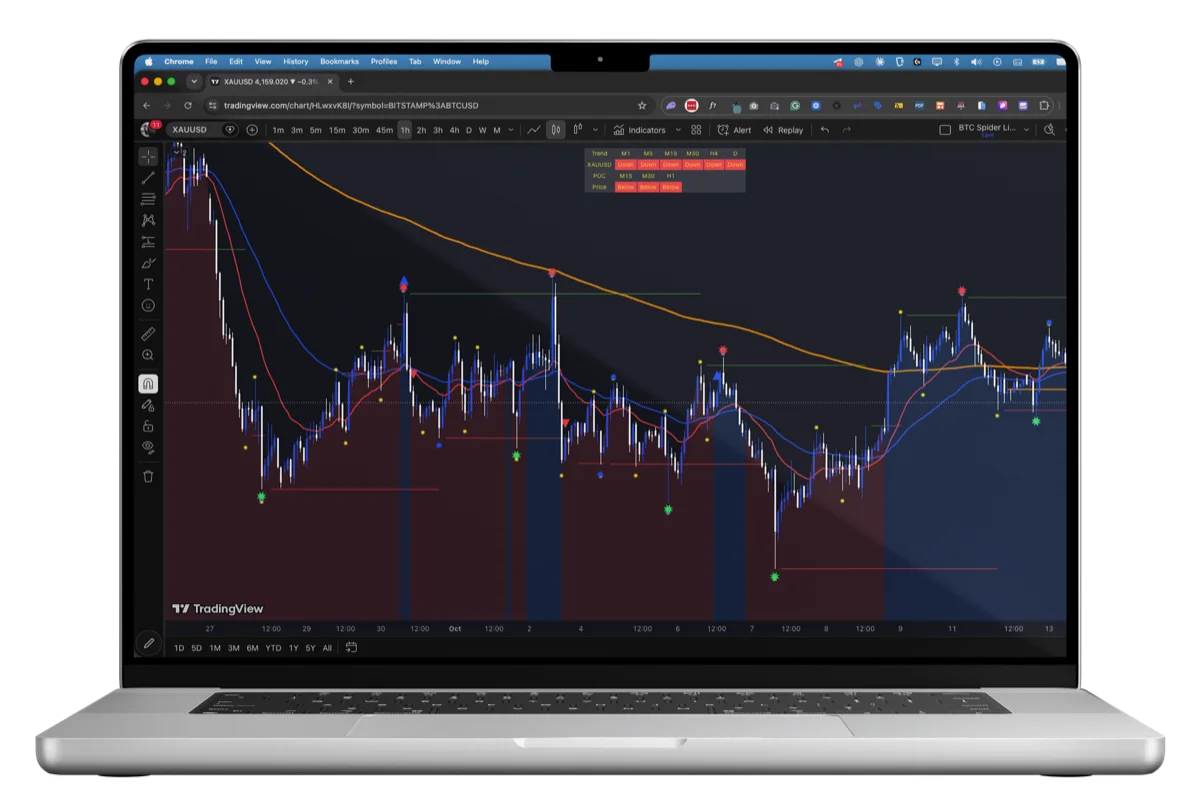
A 3-minute chart can be in an uptrend while the 1-hour chart is falling. Before you trade, check the EMAs on a few timeframes, for example M15, H1 and H4. When they agree, you have a much clearer direction. When they disagree, smaller size or no trade is often the right call. The Killshot scanner reads its trend across M3, M15, H1 and H4 for exactly this reason.
Trading pullbacks to the EMAs
In a healthy trend, price rarely moves in a straight line. It pushes, then pulls back toward the EMAs, then pushes again. Buying the pullback in an uptrend, rather than the breakout candle, usually gets you a better price and a tighter stop.
A pullback toward the EMAs that also lines up with a level, like the Point of Control or a demand zone, is stronger still. Then wait for your trigger and a candle close.
Common EMA mistakes
- Trading every crossover. Crossovers lag. By the time the 20 crosses the 50, much of the move may be over.
- Using them in ranges. Flat EMAs mean no trend. Trend tools in a range just produce losing signals.
- Treating the line as exact. The EMA is an area, not a wall. Price often overshoots it.
- Stacking too many. Five moving averages don’t tell you five times as much. Pick a pair and learn how it behaves.
Frequently asked questions
What is the difference between an EMA and an SMA?
A simple moving average (SMA) weights every candle equally. An exponential moving average (EMA) weights recent candles more, so it reacts faster to new price moves.
Why use the 20 and 50 EMA together?
The 20 shows the short-term trend and the 50 the broader one. When price is above both and the 20 is above the 50, the market is trending up.
Are EMA crossovers a good entry signal?
On their own, not usually: they lag and give many false signals in ranges. They’re better for deciding direction than for timing entries.
Which timeframe is best for EMAs?
Use more than one. Check the higher timeframes for direction, then use a lower timeframe to time your entry.