- A demand zone is an area price left sharply upward; a supply zone is one it left sharply downward.
- The strongest zones are fresh (untested) and price left them with a strong, fast move.
- Each time a zone is tested, there are fewer orders left in it.
- Stop hunts and liquidity sweeps often happen just beyond a zone before the real move.
What are supply and demand zones?
When a large buyer wants to buy more than the market can absorb at one price, they can’t fill everything at once. Price jumps away and leaves part of the order unfilled. When price comes back to that area, the remaining orders can push it away again.
That area is a demand zone (buyers waiting below the market). The opposite, an area price left sharply downward, is a supply zone (sellers waiting above).
How to draw a zone
- Find a strong move. Look for a fast, large move away from an area, usually several big-bodied candles in a row.
- Find where it started. Just before the move there’s usually a small pause, one or a few small candles. That’s the base.
- Mark the base. For a demand zone, draw from the lowest wick of the base up to the top of the base’s bodies. For supply, the reverse.
- Check the higher timeframe. A zone that lines up with a higher-timeframe level is stronger.
You’ll often see these named by their shape: rally-base-drop and drop-base-drop for supply, drop-base-rally and rally-base-rally for demand.
What makes a zone strong
| Stronger | Weaker |
|---|---|
| Fresh: price hasn’t returned yet | Already tested several times |
| Price left fast, with big candles | Price drifted away slowly |
| Short time in the base | Long, messy base |
| In line with the higher-timeframe trend | Against the trend |
Stop hunts and liquidity sweeps
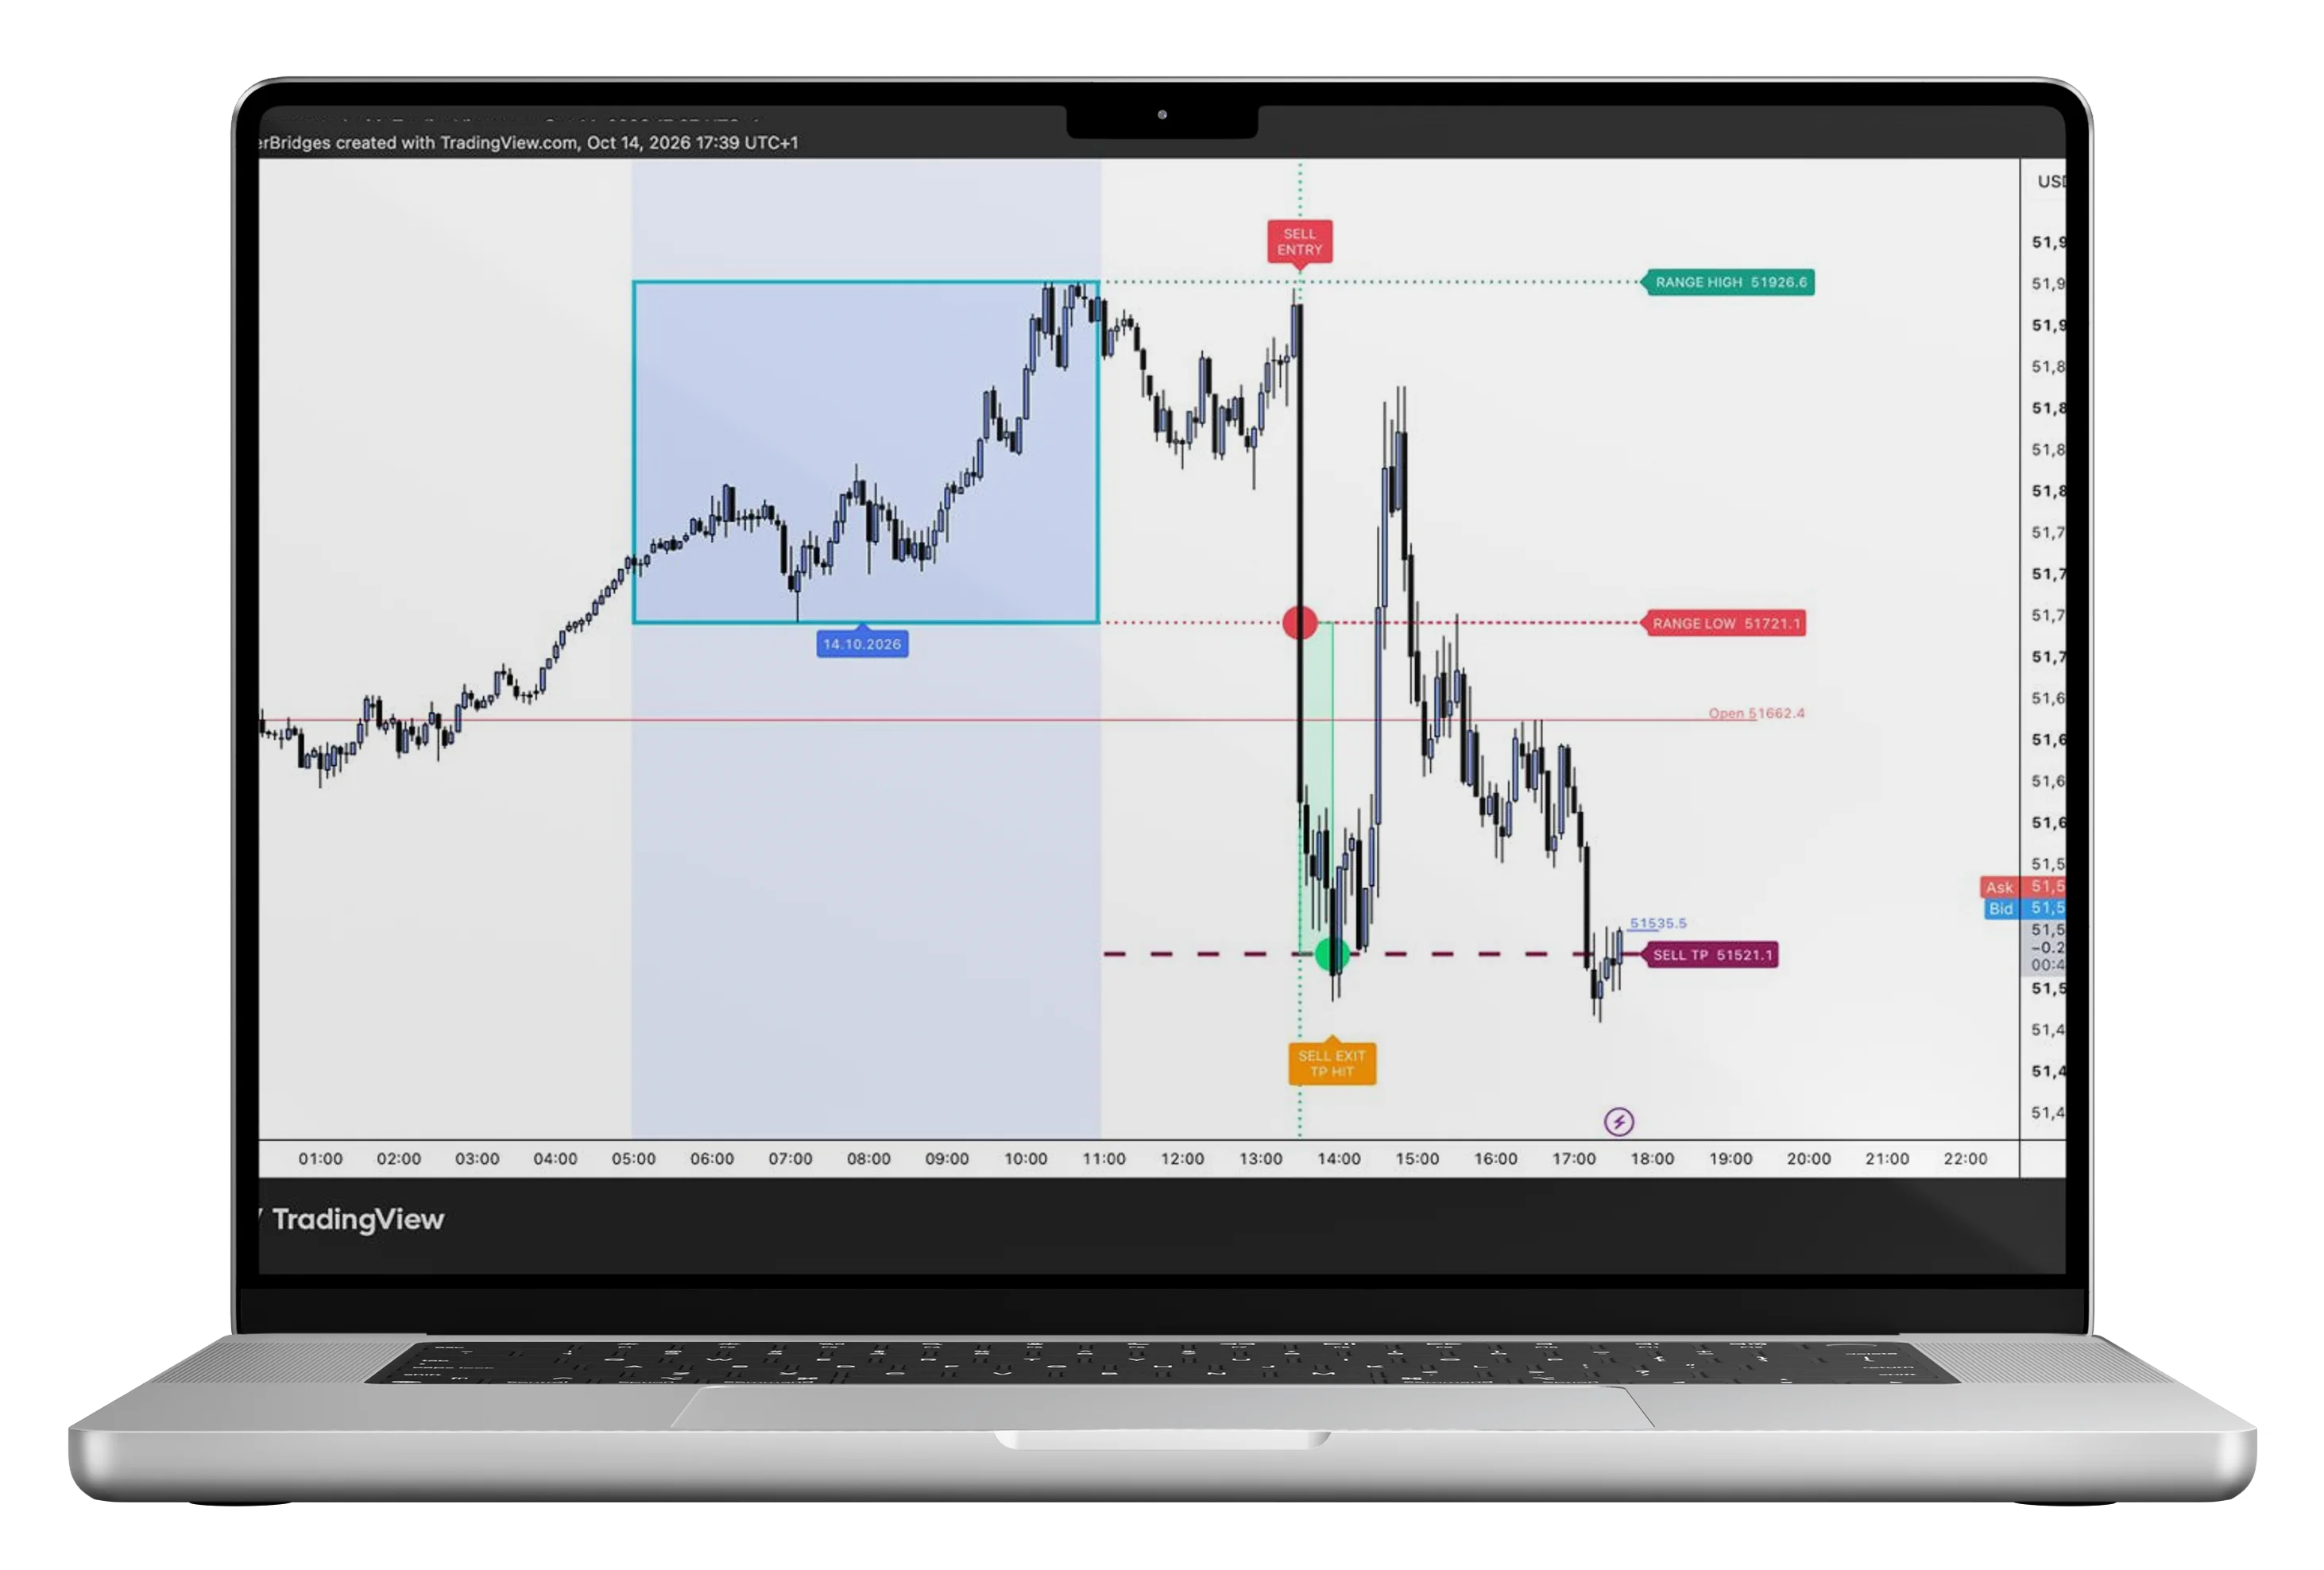
Lots of traders put their stops just beyond obvious highs, lows and zones. Those stops are liquidity: orders that larger players can use to fill their own positions. Price will often push just past a zone, trigger those stops, and then reverse.
That’s why a zone being “broken” by a wick isn’t always the end of it, and why your own stop shouldn’t sit exactly where everyone else’s does. Concepts like this are at the heart of Smart Money Concepts, which the Smartshot scanner is built on.
How to trade a zone
- Trade with the trend. Demand zones in uptrends, supply zones in downtrends.
- Wait for a reaction. Let price reach the zone and show you a rejection or engulfing candle before entering.
- Stop beyond the zone, with a little room for a sweep.
- Target the next opposing zone and check the risk-to-reward makes sense.
Frequently asked questions
What is a demand zone?
An area where price moved sharply upward, suggesting unfilled buy orders were there. When price returns, those orders can push it up again.
What is a supply zone?
An area where price moved sharply downward, suggesting unfilled sell orders. Price often reacts lower when it returns.
Are supply and demand zones the same as support and resistance?
They’re related, but zones are areas rather than single lines, and they focus on where price left quickly rather than where it bounced several times.
What is a liquidity sweep?
When price briefly pushes beyond an obvious high, low or zone to trigger the stops sitting there, then reverses. It’s common just before a strong move.