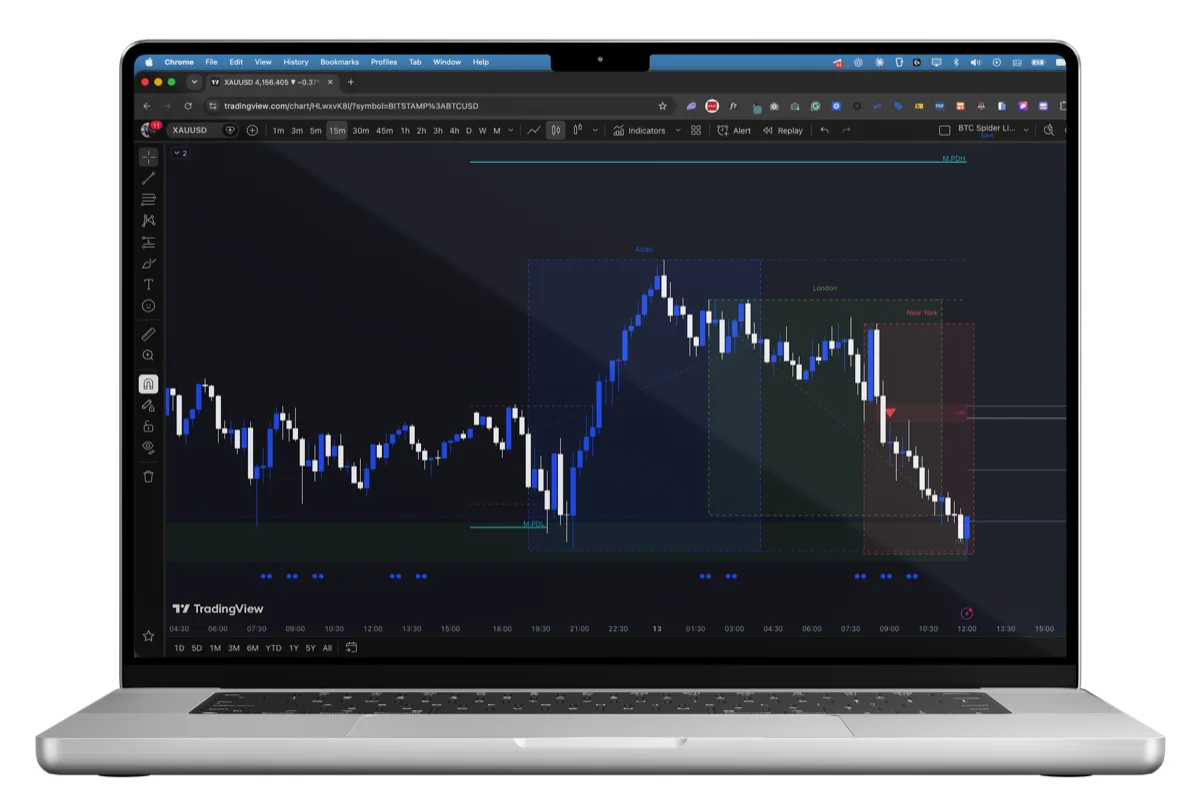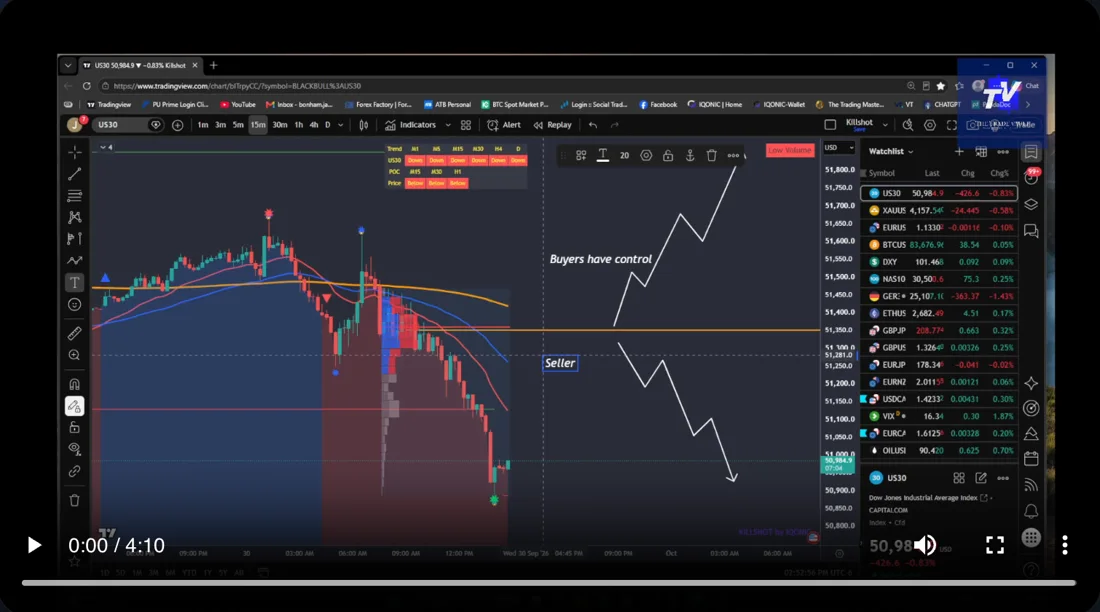
- Each candle shows four prices for its timeframe: open, high, low and close.
- The body shows open to close. The wicks show how far price went before being pushed back.
- Long wicks show rejection. Big bodies show conviction.
- Wait for the candle to close: until it does, it can still change completely.
Candle anatomy
A candlestick summarises price over one period: one minute, one hour, one day, whatever timeframe your chart is set to. It shows four prices, often called OHLC:
- Open: the price at the start of the period.
- High: the highest price reached.
- Low: the lowest price reached.
- Close: the price at the end of the period.
The thick part is the body, from open to close. The thin lines above and below are the wicks (or shadows), reaching to the high and low.
Bullish and bearish candles
If price closed higher than it opened, the candle is bullish, usually shown green or white. If it closed lower, it’s bearish, usually red or a darker colour. Colours vary between platforms, so check your settings.
The size of the body matters more than the colour. A large body means one side was in control for the whole period. A tiny body means buyers and sellers ended up roughly where they started.
What wicks tell you
A wick is a record of a failed push. A long upper wick means buyers drove price up, but sellers pushed it back down before the close. A long lower wick means sellers tried and failed.
That’s why long wicks at important levels, like the previous day’s high or the Point of Control, are worth paying attention to. They show the level being defended.
Candles worth knowing
| Candle | What it looks like | What it suggests |
|---|---|---|
| Engulfing | A body that completely covers the previous candle’s body, in the other direction | Control has switched sides |
| Rejection (pin bar) | Small body, one long wick | Price was pushed away from a level |
| Expansion | A much bigger body than recent candles | Momentum and conviction |
| Doji | Open and close almost the same | Indecision |
No single candle is a signal on its own. They matter at a level, in the direction of the trend. An engulfing candle in the middle of nowhere means very little.
Why you should wait for the close
Until a candle closes, it isn’t finished. A candle that looks like a perfect engulfing bar with ten seconds to go can turn into a long-wicked rejection the other way. Acting before the close means acting on a guess.
Candles on different timeframes
A daily candle contains 24 hourly candles, and each hourly candle contains 60 one-minute candles. What looks like a strong move on the 1-minute chart might be a tiny wick on the daily. Check the higher timeframes first to know the bigger picture, then use the lower timeframes to time your entry.
Frequently asked questions
What do the colours of a candlestick mean?
A green or white candle closed higher than it opened (bullish). A red or dark candle closed lower than it opened (bearish). Platforms let you change the colours.
What does a long wick mean?
That price moved there during the period but was pushed back before the close. A long wick at a key level often shows that level being defended.
What is an engulfing candle?
A candle whose body completely covers the previous candle’s body in the opposite direction. It suggests control has shifted from one side to the other.
Why wait for a candle to close?
Because until it closes, it can still change. Entering on an unfinished candle means trading a pattern that may never actually form.